 http://www.ex-parrot.com/~chris/wwwitter/20050407-it_doesnt_matter_how_you_vote_either_way_your_planet_is_doomed.html
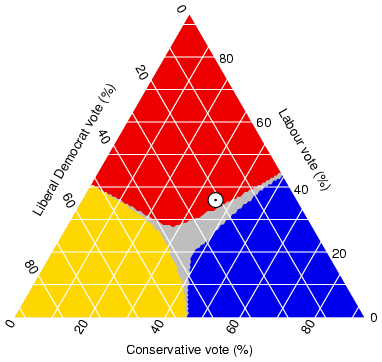
A triangular plot takes three variables and brings them to a constant in the center. This particular triangular plot displays the different types of votes that were cast in this election.
No comments:
Post a Comment