 http://support.sas.com/documentation/cdl/en/grstatproc/61948/HTML/default/a003155605.htm
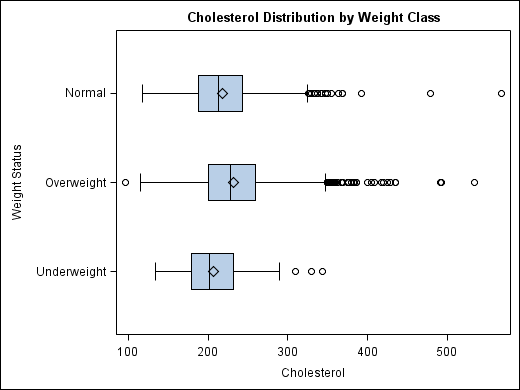
This box plot is used to display the way peoples size/weight relates to their cholesterol level. Clearly, based on this graph, underweight people tend to have lower cholesterol than those of normal and, especially, overweight people.
No comments:
Post a Comment